AI Case Study · 2024–2025 · Live in Production
National Black Food Justice Alliance
Y.A.M.S: AI-Powered Receipt Intelligence Platform for Community Food Justice
A full-stack AI receipt intelligence ecosystem empowering Black communities with market data — built by Jerry Bony.
387
Registered Users
1,232
Receipts Processed
285
Merchants Captured
24.6%
Toward 5K Goal
2×
Maintenance Renewals
The Challenge
Black communities across the United States are systematically underserved by food markets — not because of lack of demand, but because of lack of data.
Traditional market research has historically ignored or misrepresented Black consumer behavior and food purchasing patterns, leaving Black-owned grocery stores, cooperatives, and farmers markets without the evidence base needed to make informed business decisions or attract investment.
The National Black Food Justice Alliance needed a scalable, community-driven solution to capture authentic purchasing data directly from Black consumers — data that could empower both the community and the Black-owned food ecosystem. Their research milestone: 5,000 processed receipts representing statistically significant market intelligence.
The Solution: Y.A.M.S Platform
Y.A.M.S (Yielding Access to Market Solutions) is a full-stack AI receipt intelligence ecosystem with three integrated components: a React Native mobile app for community data collection, a multi-model AI processing pipeline for extraction and normalization, and a Next.js admin portal where raw receipt data becomes actionable food justice intelligence.
Three stakeholders, one platform
- 1Community members — photograph receipts via the Y.A.M.S mobile app and gain access to their own organized spending history and receipt archive
- 2NBFJA researchers — access the admin portal to analyze aggregated purchasing patterns, filter by geography and store type, and export CSV reports for policy advocacy and funder reporting
- 3Black-owned food businesses — cooperatives, grocery stores, and farmers markets receive scoped contractor dashboards showing their own community purchasing data
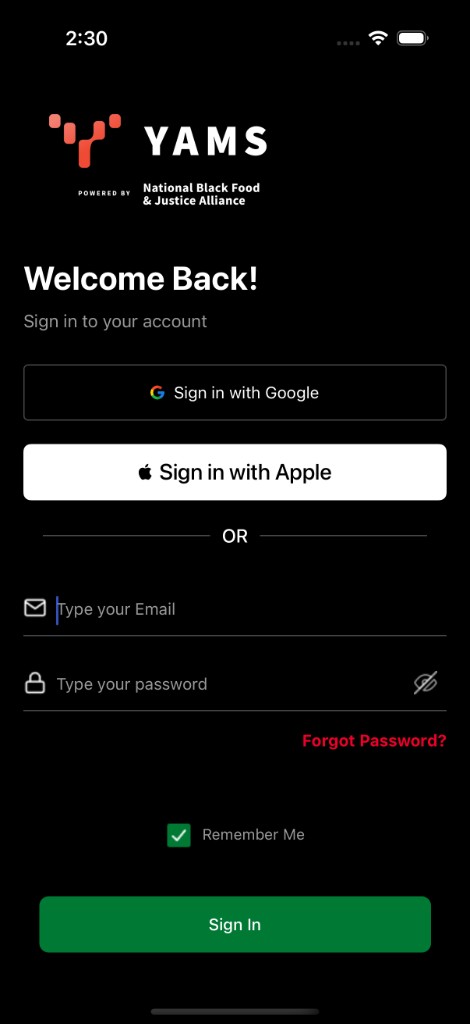
Mobile App: User Flow
Community members use the Y.A.M.S app to submit receipts and track their spending. Here's how the flow works — from dashboard to upload to viewing extracted data and category breakdowns.
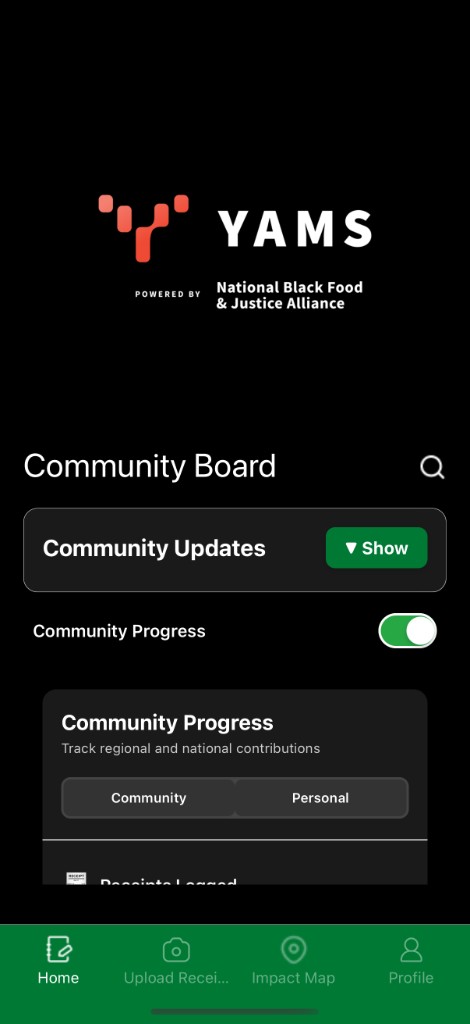
Dashboard & Community Board
The home screen surfaces Community Updates (blog posts and announcements) and Community Progress — receipts logged, total spending, and categories tracked. Users can toggle between community-wide and personal views.
Receipts Logged shows progress toward the 5,000-receipt research milestone. Categories Tracked links to spending breakdowns by community or personal scope.
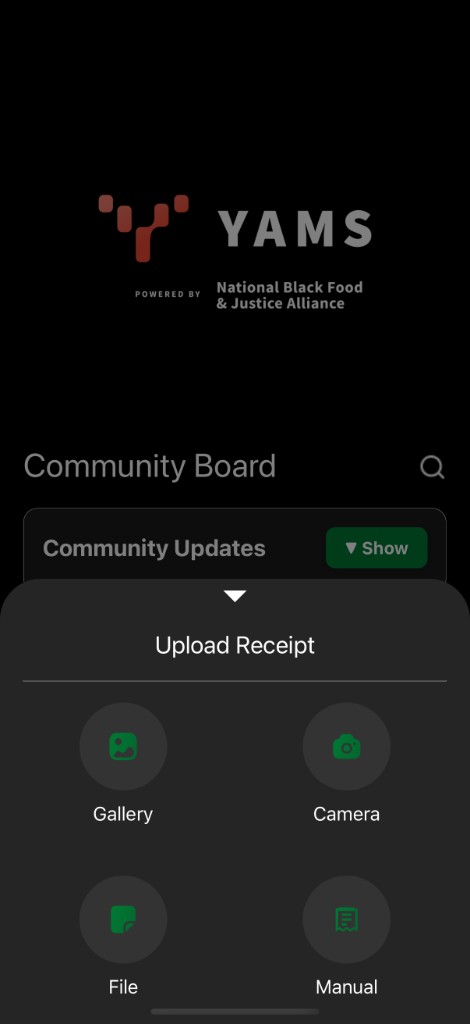
Upload Receipt: Gallery, Camera, File, or Manual
Tapping the upload button opens options to add a receipt: Gallery (choose an existing photo), Camera (take a new photo), File (select from device storage), or Manual (enter details by hand). No friction — users submit however they prefer.
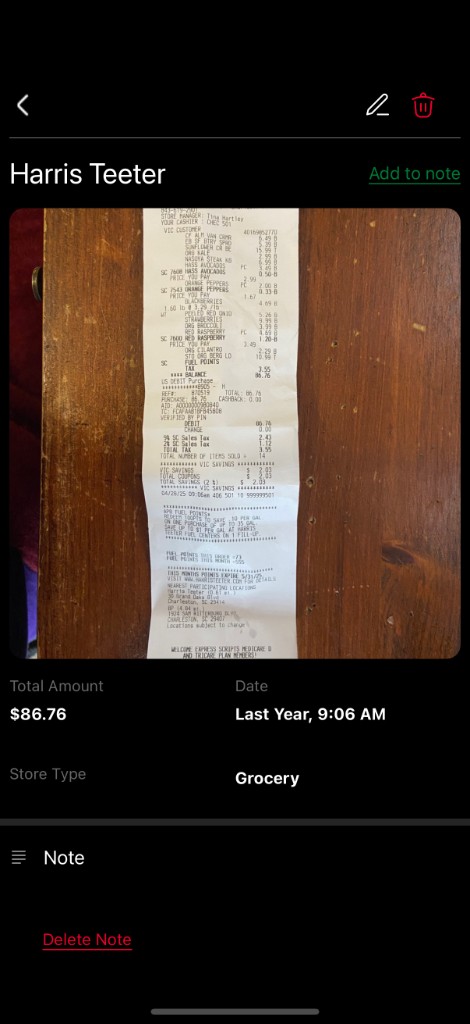
Receipt Details Stored
After upload, the AI pipeline extracts structured data. Users see the scanned receipt image plus extracted fields: total amount, date, store type. The system stores merchant, line items, totals, and location — ready for analytics.
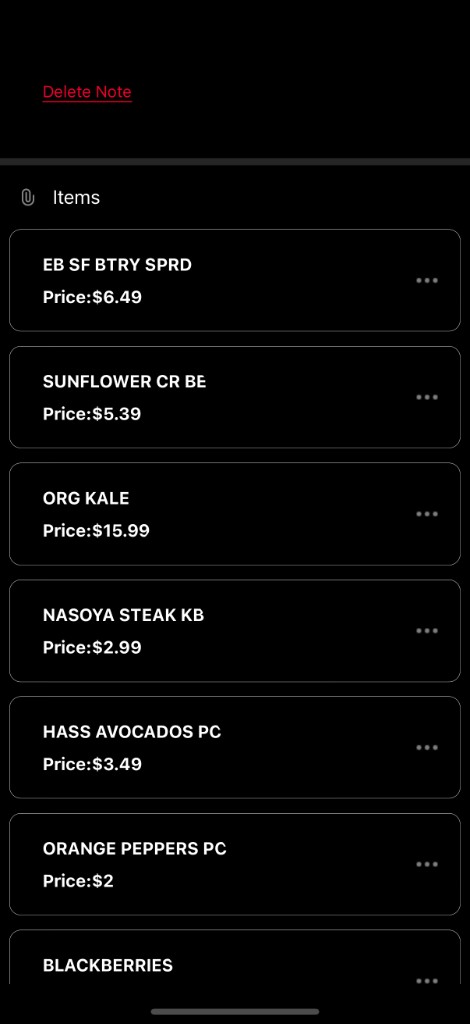
List of Groceries Stored
Each receipt's line items are extracted and stored as a structured list. Users can view individual groceries with names and prices — the raw data that feeds category breakdowns and community analytics.
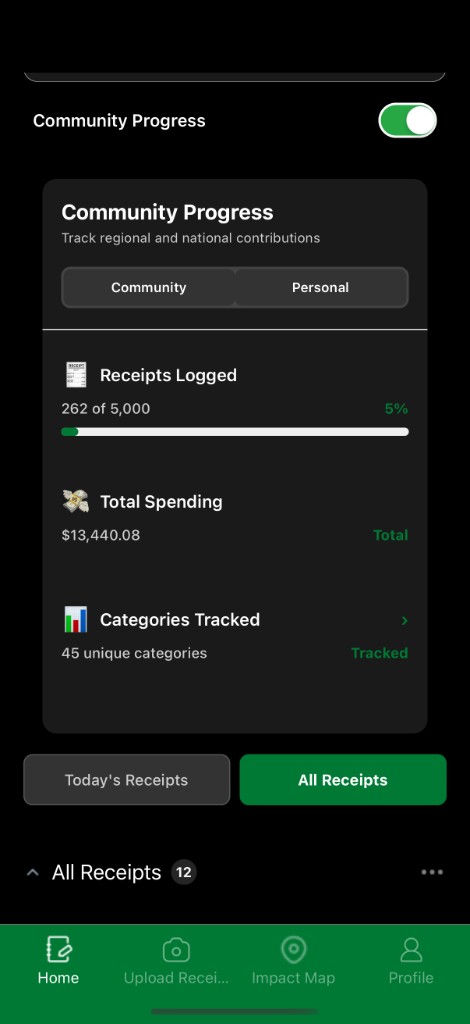
Category Breakdown: Community or Personal
The Community Progress card lets users switch between Community (regional and national contributions) and Personal views. Receipts Logged, Total Spending, and Categories Tracked are shown for the selected scope. Tap Categories to drill into spending by category.
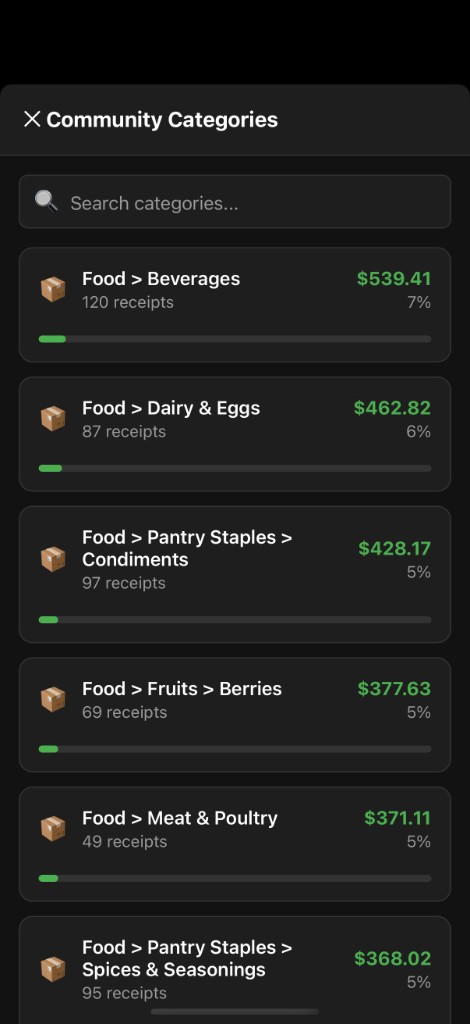
Community Category Spending Breakdown
Community Categories shows aggregated spending by food category across all community submissions: Beverages, Dairy & Eggs, Pantry Staples, Fruits, Meat & Poultry, and more. Each category displays receipt count, total amount, and percentage of overall spending.
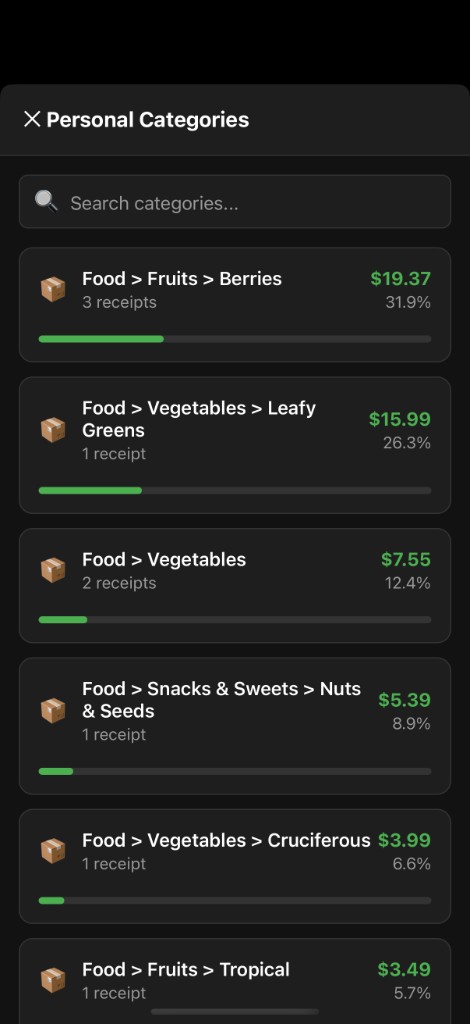
Personal Category Spending
Personal Categories shows the user's own spending by category — Fruits & Berries, Vegetables, Snacks, and more. Receipt count, amount spent, and percentage of personal total help users understand their own purchasing patterns.
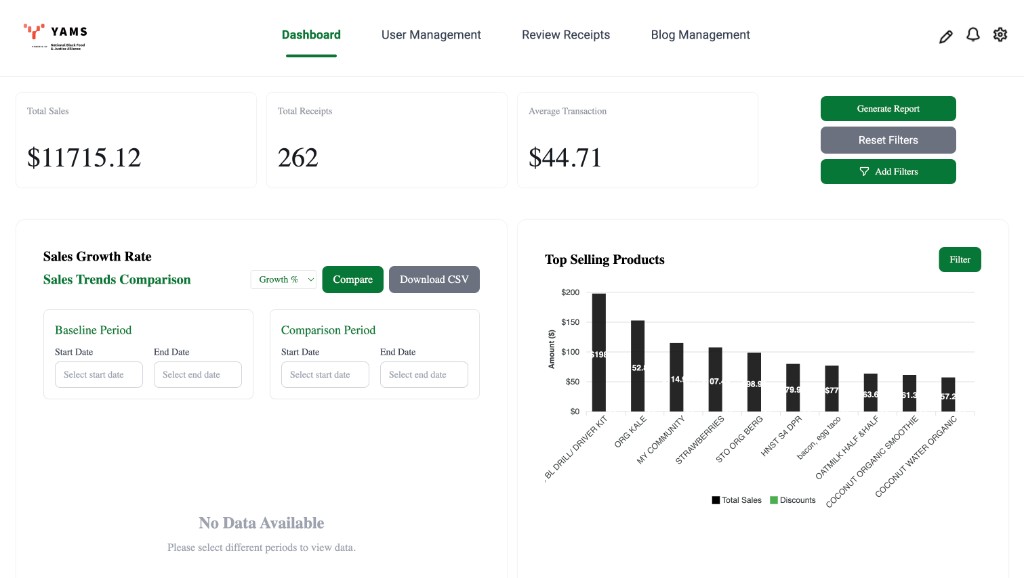
Admin Portal: Research Intelligence Hub
The Next.js admin portal is the operational core — where receipt data becomes food justice intelligence. NBFJA staff monitor live KPIs (sales volume, receipt count, average transaction value, unique shopper count), dynamic charts for sales growth and top-selling products, and a geographic intelligence layer mapping shopper ZIP codes against store ZIP codes to quantify food access gaps.
All analytics are filterable by region, state, ZIP code, store type (grocery store, farmers market, co-op), date range, and merchant name. The portal manages contractor access for Black-owned cooperatives — co-ops submit requests, NBFJA approves them, and approved contractors receive scoped dashboards limited to their own data.
Platform Capabilities → Food Justice Impact
How each technical capability serves the mission
| Portal Capability | Food Justice Impact |
|---|---|
| Shopper Distance Insights | Quantifies food access gaps — measures how far people travel for groceries in underserved communities |
| Store Type Filtering | Compares grocery chains vs farmers markets vs co-ops to understand where communities actually shop |
| Geographic Filters | Enables ZIP-level focus on specific communities such as South St. Petersburg |
| Top Selling Products | Reveals what people buy and where discounts matter most for low-income households |
| Contractor (Co-op) Access | Gives Black-owned cooperatives their own market data to make informed inventory and pricing decisions |
| CSV Report Export | Supports grant reporting, policy advocacy, and evidence-based community presentations |
AI & Technical Architecture
Receipt Extraction
Taggun OCR model
Extracts merchant, line items, totals, date, location
Data Normalization
OpenAI GPT
Normalizes data into structured JSON, resolves variants, categorizes store types
Mobile App
React Native
Cross-platform iOS/Android with camera, receipt history, spending dashboard
Admin Portal
Next.js
KPI dashboards, geographic mapping, contractor management, CSV export
Backend
Python
REST API, image upload, AI pipeline orchestration, data aggregation
Database
MongoDB
Document store for users, receipts, merchants, cooperatives
Results & Traction
The Y.A.M.S platform launched in production in late 2024 and has grown organically through NBFJA's community promotion. As of early 2026, the platform has processed 1,232 receipts — 24.6% of the 5,000-receipt research milestone — and is on track to reach that goal within the year.
- ✓387 verified community members registered across multiple US markets
- ✓1,232 receipts processed through the full AI extraction and normalization pipeline
- ✓285 unique merchants captured spanning grocery chains, farmers markets, and cooperatives
- ✓Rich demographic dataset linking purchasing behavior to income levels, age ranges, and zip codes
- ✓Full geographic intelligence layer mapping shopper travel distances to food sources
Development & Engagement
Jerry Bony served as lead developer on a $74,000 contract, responsible for 85% of the full-stack build — including AI pipeline integration, backend architecture, database design, mobile application development, Next.js admin portal, and production deployment.
A lean team structure delivered a production-grade, live application on an independent contractor timeline. NBFJA has since renewed the maintenance contract twice, reflecting continued confidence in the system's performance, reliability, and ongoing value to their food justice research mission.
Transferability to Other Industries
The core architecture — unstructured document input → OCR extraction → LLM normalization → structured queryable data → analytics and reporting — is directly transferable to insurance, legal, healthcare, and financial services.
Any organization dealing with high volumes of unstructured documents (claims, contracts, invoices, medical records) can benefit from the same pipeline. This engagement demonstrates that such systems can be designed, built, and deployed at production scale by a lean team within a defined contract budget.
Need Technology Solutions for Your Mission?
Whether you're building AI-powered data collection, document intelligence, or analytics dashboards —
let's talk about how we can help.
No obligation · 15-minute call · Discuss your technology needs